Author Archives: jessica.hampton@gmail.com

Using an IF Block to Write Dynamic SQL

Sometimes I want a code block to differ slightly depending on the value of a parameter input to a macro. This is easily done using a %if statement with the %str function to add a block of code if a certain condition is met. Some examples are shown below: the first one shows adding a join in the FROM statement if the MARKET parameter = ‘MF’, while the second example adds more fields to the SELECT statement depending on the value of the POST_ELIG_MONTHS parameter. Don’t forget to add a semi-colon after the %if statement. You can use this in many different ways to add flexibility to your code.

Example 1:
%macro cohort_rx(cohort=,market=,index_yr=,post_elig_months=);
proc sql;
create table drv_com_&cohort as
select distinct
a.nhi_individual_id,
a.index_dt
from proj.index_com_&cohort a
join proj.elig_&cohort._com b on a.nhi_individual_id=b.nhi_individual_id
%if %unquote(%str(%’&market%’))=’MF’ %then %str(
join proj.dx_com_&cohort._&market. c on a.nhi_individual_id=c.nhi_individual_id
)
;

where b.months_elig_pre>=3
and b.months_elig_post>=&post_elig_months
and a.index_yr=&index_yr
and a.nhi_individual_id not in(select nhi_individual_id from proj.prior_rx_com_&cohort)
;
quit;
%mend;

Example 2:
proc sql;
create table proj.persistency_&cohort._sum as
select
%unquote(%str(%’&cohort%’)) as cohort
,’Persistent’ as metric
,sum(case when p1=1 then 1 else 0 end) as p1 label=’Month 1′
,sum(case when p2=1 then 1 else 0 end) as p2 label=’Month 2′
,sum(case when p3=1 then 1 else 0 end) as p3 label=’Month 3′
,sum(case when p4=1 then 1 else 0 end) as p4 label=’Month 4′
,sum(case when p5=1 then 1 else 0 end) as p5 label=’Month 5′
,sum(case when p6=1 then 1 else 0 end) as p6 label=’Month 6′
%if &post_elig_months=12 or &post_elig_months=24 %then %str(
,sum(case when p7=1 then 1 else 0 end) as p7 label=’Month 7′
,sum(case when p8=1 then 1 else 0 end) as p8 label=’Month 8′
,sum(case when p9=1 then 1 else 0 end) as p9 label=’Month 9′
,sum(case when p10=1 then 1 else 0 end) as p10 label=’Month 10′
,sum(case when p11=1 then 1 else 0 end) as p11 label=’Month 11′
,sum(case when p12=1 then 1 else 0 end) as p12 label=’Month 12′
)
;
%if &post_elig_months=24 %then %str(
,sum(case when p13=1 then 1 else 0 end) as p13 label=’Month 13′
,sum(case when p14=1 then 1 else 0 end) as p14 label=’Month 14′
,sum(case when p15=1 then 1 else 0 end) as p15 label=’Month 15′
,sum(case when p16=1 then 1 else 0 end) as p16 label=’Month 16′
,sum(case when p17=1 then 1 else 0 end) as p17 label=’Month 17′
,sum(case when p18=1 then 1 else 0 end) as p18 label=’Month 18′
,sum(case when p19=1 then 1 else 0 end) as p19 label=’Month 19′
,sum(case when p20=1 then 1 else 0 end) as p20 label=’Month 20′
,sum(case when p21=1 then 1 else 0 end) as p21 label=’Month 21′
,sum(case when p22=1 then 1 else 0 end) as p22 label=’Month 22′
,sum(case when p23=1 then 1 else 0 end) as p23 label=’Month 23′
,sum(case when p24=1 then 1 else 0 end) as p24 label=’Month 24′
)
;

from proj.persistency_&cohort
group by
1,2
;
quit;
Getting Teradata to Recognize SAS Dates

Frequently I have a table with member IDs and index dates that I want to load into Teradata as a driver table. I use this driver table to limit a claims extraction to a time period relative to the index date field values. For example, I want to pull pharmacy claims for a specific set of members who filled a prescription in the time period between 90 days prior to the index date and 30 days after the index date occurred. Sometimes I load my table into Teradata and run my claims extraction but the query results in an empty table and no error messages. Usually this is because Teradata does not recognize my SAS date (drv.index_dt) in the WHERE clause. I can return the results I want by simply reformatting my SAS date as yymmdd10. before loading the table into Teradata as follows:

%let drv = &sysuserid;
proc sql;
create table drv as
select distinct
individual_id
,index_dt format yymmdd10.
from proj.index_com
;
quit;

proc append base=tddata.&drv (FASTLOAD=YES)
data=work.drv;
run;

proc sql;
CONNECT TO TERADATA(tdpid=NHIPROD schema=dnhiview user=”&sysuserid@LDAP” password=”&unixpass”);
execute (diagnostic noprodjoin on for session) by teradata;
CREATE TABLE proj.drugs_rx as
select NHI.*
from connection to TERADATA
(
select drv.individual_id,
a.fill_date as fill_dt
from dodview.pharmacy_claim a
inner join
NHIPDHMMSANDBOX.&drv drv /*join to driver table*/
on a.individual_id = drv.individual_id
where a.fill_date between drv.index_dt-90 and drv.index_dt+30
and (
brand_name like any (‘%LEVOTHYROID%’,’%LEVOXYL%’,’%SYNTHROID%’,’%TIROSINT%’,’%UNITHROID%’,’%LEVOTHYROXINE%’) or
generic_name like any (‘%LEVOTHYROID%’,’%LEVOXYL%’,’%SYNTHROID%’,’%TIROSINT%’,’%UNITHROID%’,’%LEVOTHYROXINE%’)
)
group by 1,2
) nhi;
quit;

Execute Excel Commands from SAS

There are a few ways to execute Excel commands from SAS, but this method uses DDE (“Dynamic Data Exchange”) to facilitate communication between the two applications. For this example, I want to open 25 multisheet XML workbooks in Excel, call an Excel macro to run for each tab, and then re-save the XML files as XLSX files before closing them. In order to cycle through each of these XML output files, I also use a macro in SAS, which I run using call execute in a data step. Continue reading

Using Name Literals in SAS

Most of us use date or datetime literals in SAS all the time. For example, take ’01JAN2014’d — the single quotes enclosing the date constant are tagged with a “d” to announce to SAS that the enclosed value is a date, not a character string. There are also rare occasions when you may be forced to use a name literal. For instance, you may need to reference columns which have nonstandard names that include spaces and/or special characters, violating SAS naming conventions. Frequently, this happens if you are using an Excel file which has been imported into SAS (especially using the Enterprise Guide import wizard) without someone first checking to make sure that the column names are appropriate. Ideally, you would rename the columns and/or reimport the file after it has been cleaned up.

This is not always possible if you are referencing a DBMS table with nonstandard column names. If you are accustomed to writing SQL in a DBMS, you may know that you can reference column names which have spaces in them by enclosing them in brackets: [Total Cost]. This does not work in SAS, however.

The only way to do this is SAS is to use name literals to reference those columns, combined with resetting the VALIDVARNAME SAS system option as follows:

options validvarname=any;
SELECT *
FROM Table
WHERE ‘Total Cost’n > 0;

This system option by default is set to validvarname=V7 in Base SAS, but using validvarname=any causes SAS to accept nonstandard column/variable names. The import wizard in EG will “helpfully” reset the system option for you to “any”, resulting in importing the spreadsheet with the original nonstandard column names. If you then try to reference these unusual column names without using a name literal, you will get errors in your log. Here are some other examples of name literals:

‘# of Months’n
‘Date*’n
‘$ Total’n

Create Cumulative Lift Charts in SAS Without Enterprise Miner

SAS Enterprise Miner creates cumulative lift charts for you as part of the model evaluation process (for more about cumulative lift charts, see my previous post). But what if you don’t have access to SAS EM and want to create a lift chart in Base SAS?

First we can use PROC RANK to order the observations in the scored dataset and assign to a decile. We’ll use the deciles as points on the X axis in the cumulative lift chart:

proc rank data=sasuser.scored_data out=deciles ties=low
descending groups=10;
var score;
ranks decile;
run;

Next we find the true positive rate for each decile by summing the positive values for the target. Our target variable is a binary variable with 1 indicating a positive value and 0 a negative value. Since PROC RANK gave the decile values from 0-9, we add 1 to this value so we will eventually have values of 1-10 on the X axis:

proc sql;
select sum(target) into: total_hits
from sasuser.scored_data
;
create table lift as
select
sum(target)/&total_hits as true_positive_rate
,decile + 1 as decile
from deciles
group by decile
order by decile
;
quit;

Finally, we use a data step to get the cumulative lift:

data cum_lift;
set lift;
cum_positive_rate + true_positive_rate;
cum_lift=cum_positive_rate/(decile/10);
run;

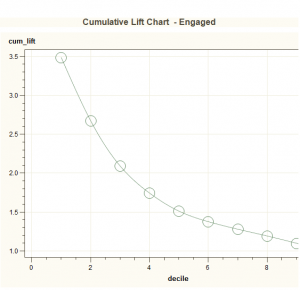
Now the data is ready to plot with PROC GPLOT. We use the symbol statement with i=spline to add a line to the graph connecting all the points (click on the image below to enlarge):

proc gplot data=cum_lift;
title ‘Cumulative Lift Chart’;
symbol i=spline;
plot cum_lift*decile /grid;
run;
quit;

cum_lift