Category Archives: Uncategorized

Model Evaluation: Explaining the Cumulative Lift Chart

I recently developed a model for a client in which the goal was to identify at-risk customers with chronic conditions to target for outreach in a health coaching program. By targeting the customer for outreach, we hoped to improve the patient’s health, medication adherence, and avoid costly emergency room visits and inpatient admissions. In order to explain how effective the model was, I used a cumulative lift chart created in SAS Enterprise Miner (click the image below to enlarge):

lift_chart

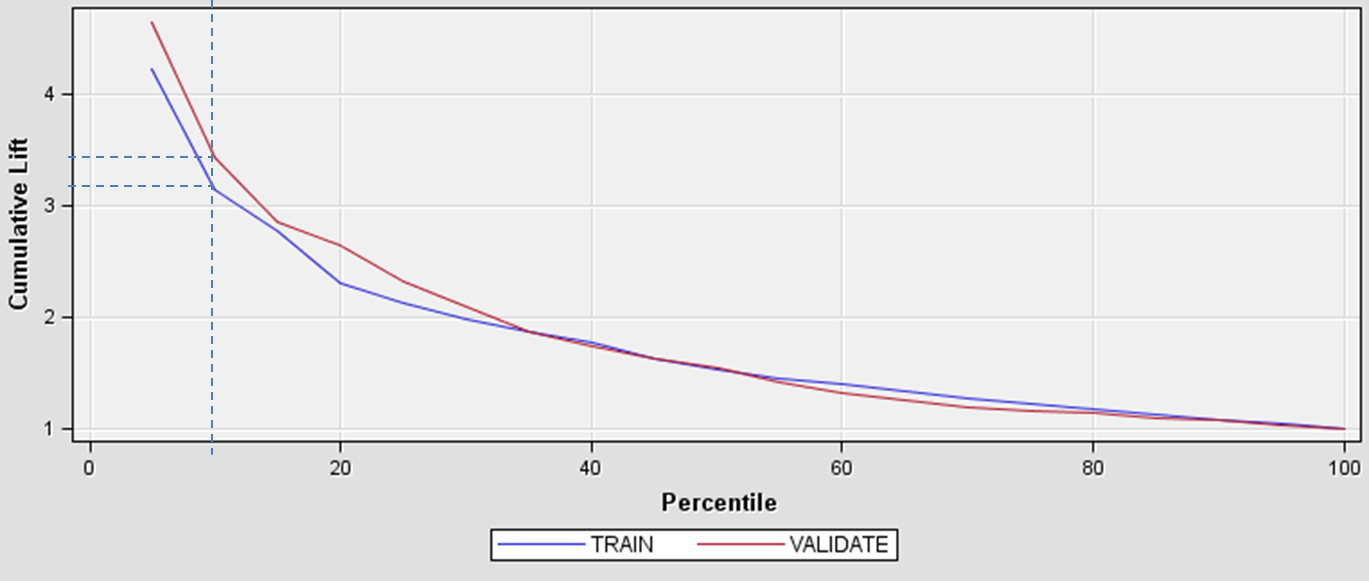
The x-axis shows the percentile and the y-axis shows lift. Keep in mind that the default (no model), is a horizontal line intersecting the y-axis at 1. If we contact a random 10% of the population using no model, we should get 10% of the at-risk customers by default; this is what we mean by no lift (or lift=1). The chart above shows that using the given model we should be able to capture 32-34% of the at-risk customers for intervention if we contact the customers with risk scores in the top 10 percentile (shown by the dashed line). That is more than 3 times as many as if we use no model, so that is our “lift” over the baseline. Here is another example using te same chart: we can move to the right on the lift curve and contact the top 20% of our customers, and we would end up with a lift of about 2.5. This means that by using the model, we could capture about 50% of the at-risk customers if we contact just 20% of them.

The cumulative lift chart visually shows the advantage of using a predictive model to choose who to outreach by answering the question of how much more likely we are to reach those at risk than if we contact a random sample of customers.

Survey Design: Stratification & Clustering

In a previous post, I talked about importing Medical Expenditure Panel Survey (MEPS) data into SAS. MEPS survey design is complex, with person weights, stratification and multi-stage clustering techniques; it is not a random sample of the population. Stratification is a survey design technique which is typically done by demographic variables such as age, race, sex, income, etc. The goal is to maximize homogeneity within strata and heterogeneity between strata. Sometimes stratification is used when it is desirable to oversample certain groups under-represented in the general population or with interesting characteristics relevant to what is being studied (for example, blacks, Hispanics, and low-income households).

Clustering is typically done by geography in order to reduce survey costs, where it is not feasible or cost-effective to do a random sample of the entire population of the U.S., for example. Within-cluster correlation underestimates variance/error, as two families in the same neighborhood are more likely to be similar demographically (in regard to income, for instance). Therefore, we want clusters to be spatially close for cost effectiveness but as heterogeneous within as possible for reasonable variance. Sometimes a multi-stage clustering approach is used, as in MEPS; for example, a sample of counties is taken, then a sample of blocks is taken from that sample of counties, and finally individuals/households are surveyed from the sample of blocks. Information about how the survey was designed is then stored in survey design variables which are included in the dataset. These survey design variables are used to obtain population means and estimates and can also be used in regression analysis with procedures such as PROC SURVEYREG and PROC SURVEYLOGISTIC.

If person weights are ignored and one tries to generalize sample findings to the entire population, total numbers, percentages, or means are inflated for the groups that are oversampled and underestimated for others. It is therefore highly undesirable to estimate population frequencies or means without using person weights or SAS procedures such as PROC SURVEYMEANS and PROC SURVEYFREQ. In regression analysis, ignoring person weights leads to biased coefficient estimates. If sampling strata and cluster variables are ignored, means and coefficient estimates are unaffected, but standard error (or population variance) may be underestimated; that is, the reliability of an estimate may be overestimated. For example, when comparing one estimated population mean to another, the difference may appear to be statistically significant when it is not.

What is SAS Visual Analytics?

SAS Visual Analytics was highlighted at this year’s Global Forum opening session as one of the biggest developments for SAS in recent memory. In essence it is a powerful data visualization tool that uses a high-performance SAS LASR Analytic Server and a distributed computing environment to improve the data exploration and model development process by making it faster, more automatic, and adding a web-based, interactive user interface. Most users do not have access to this product since it is so new, but it can be advantageous to develop a knowledge of analytic products currently available in the industry.

According to SAS, Visual Analytics allows users to:

  • Visually explore huge amounts of data extremely quickly
  • Execute analytic correlations in seconds
  • Deliver results quickly wherever needed (V.A. supports web reports and mobile devices such as the iPad).

Users wishing to learn more about this new product offering from SAS can read about key features, system requirements, and access both screenshots and demos through the SAS Visual Analytics site: www.sas.com/technologies/bi/visual-analytics.html.

Book Review: Web Development with SAS by Example

Title: Web Development with SAS by Example, 3rd edition
Author: Frederick Pratter
Publisher: SAS Publishing
Pages: 354 pages
Available: September 2011

This ambitious volume covers how to deliver your SAS output online from start to finish in a mere 360 pages. Pratter assumes his audience has no prior knowledge of web programming, giving a thorough introduction in his first four chapters to the basics of HTML and XML, static vs. dynamic web pages, and how the internet works along with some background history on TCP/IP, different types of web servers, and a whole host of acronyms. Chapters 5 and 6 in Part II outline different ways to access your data, focusing on SAS/SHARE and SAS/ACCESS, with examples of how to use SQL pass-through for both and information to help the reader in selecting an appropriate method of access. I found the section on OLEDB/ODBC here interesting as well. Part III goes on to introduce SAS/IntrNet, Part IV devotes five chapters to SAS BI Server, and the book concludes with some Java.

One of the strengths of this book is that Pratter throughout shows multiple ways of displaying and accessing the same data, for example contrasting various “old school” programming methods with ODS HTML statements and Proc Access vs. the newer SAS/Access interface. Such examples demonstrate how SAS has evolved since its earlier versions and may be of interest to both experienced and newer programmers. A challenge of this book is that a lot of SAS users are not familiar with administrative aspects such as server configurations, including TCP, and may find some of this material harder to understand.

SEMMA and CRISP-DM: Data Mining Methodologies

Data mining is the process of examining large sets of data for previously unsuspected patterns which can give us useful information. Data mining has a great variety of applications: it can be used to try to predict future events (such as stock prices or football scores), cluster populations into groups of people having similar characteristics, or estimate the likelihood of certain health conditions being present given other known variables.

Cross Industry Standard Process for Data Mining (CRISP-DM) is a 6-phase model of the entire data mining process, from start to finish, that is broadly applicable across industries for a wide array of data mining projects. To see a visual representation of this model, visit www.crisp-dm.org.

CRISP-DM is not the only standard process for data mining. SEMMA, from SAS Institute, is an alternative methodology:
Sample – the subset of data should be large enough to be a representative sample but not too large of a dataset to process easily
Explore – look for patterns in the data
Modify – create and transform variables, or eliminate unnecessary ones
Model – select and apply a model that best fits your situation and data
Assess – determine whether or not your results are useful and reliable. Test your results against known data or another sample

According to the SAS website: “SEMMA is not a data mining methodology but rather a logical organisation of the functional tool set of SAS Enterprise Miner for carrying out the core tasks of data mining. Enterprise Miner can be used as part of any iterative data mining methodology adopted by the client. Naturally steps such as formulating a well defined business or research problem and assembling quality representative data sources are critical to the overall success of any data mining project. SEMMA is focused on the model development aspects of data mining.”

This is a good summary of some of the differences between CRISP-DM and SEMMA. Firstly, SEMMA was developed with a specific data mining software package in mind (Enterprise Miner), rather than designed to be applicable with a broader range of data mining tools and the general business environment. Since it is focused on SAS Enterprise Miner software and on model development specifically, it places less emphasis on the initial planning phases covered in CRISP-DM (Business Understanding and Data Understanding phases) and omits entirely the Deployment phase.

That said, there are some similarities as well. The Sample and Explore stages of SEMMA roughly correspond with the Data Understanding phase of CRISP-DM; Modify translates to the Data Preparation phase; Model is obviously the Modeling phase, and Assess parallels the Evaluation phase of CRISP-DM. Additionally, both models are intended to be somewhat cyclical rather than linear in nature. The SEMMA model recommends returning to the Explore stage in response to new information that comes to light in later stages which may necessitate changes to the data. The CRISP-DM model also emphasizes data mining as a non-linear, adaptive process.