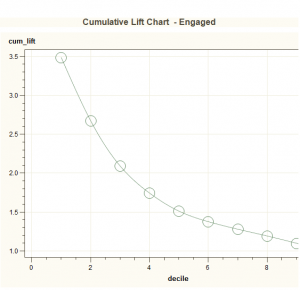
SAS Enterprise Miner creates cumulative lift charts for you as part of the model evaluation process (for more about cumulative lift charts, see my previous post). But what if you don’t have access to SAS EM and want to create a lift chart in Base SAS?
First we can use PROC RANK to order the observations in the scored dataset and assign to a decile. We’ll use the deciles as points on the X axis in the cumulative lift chart:
proc rank data=sasuser.scored_data out=deciles ties=low
descending groups=10;
var score;
ranks decile;
run;
Next we find the true positive rate for each decile by summing the positive values for the target. Our target variable is a binary variable with 1 indicating a positive value and 0 a negative value. Since PROC RANK gave the decile values from 0-9, we add 1 to this value so we will eventually have values of 1-10 on the X axis:
proc sql;
select sum(target) into: total_hits
from sasuser.scored_data
;
create table lift as
select
sum(target)/&total_hits as true_positive_rate
,decile + 1 as decile
from deciles
group by decile
order by decile
;
quit;
Finally, we use a data step to get the cumulative lift:
data cum_lift;
set lift;
cum_positive_rate + true_positive_rate;
cum_lift=cum_positive_rate/(decile/10);
run;
Now the data is ready to plot with PROC GPLOT. We use the symbol statement with i=spline to add a line to the graph connecting all the points (click on the image below to enlarge):
proc gplot data=cum_lift;
title ‘Cumulative Lift Chart’;
symbol i=spline;
plot cum_lift*decile /grid;
run;
quit;
