Tag Archives: enterprise miner

Model Evaluation: Explaining the Cumulative Lift Chart

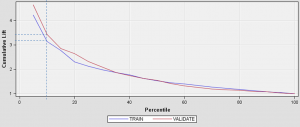
I recently developed a model for a client in which the goal was to identify at-risk customers with chronic conditions to target for outreach in a health coaching program. By targeting the customer for outreach, we hoped to improve the patient’s health, medication adherence, and avoid costly emergency room visits and inpatient admissions. In order to explain how effective the model was, I used a cumulative lift chart created in SAS Enterprise Miner (click the image below to enlarge):

lift_chart

The x-axis shows the percentile and the y-axis shows lift. Keep in mind that the default (no model), is a horizontal line intersecting the y-axis at 1. If we contact a random 10% of the population using no model, we should get 10% of the at-risk customers by default; this is what we mean by no lift (or lift=1). The chart above shows that using the given model we should be able to capture 32-34% of the at-risk customers for intervention if we contact the customers with risk scores in the top 10 percentile (shown by the dashed line). That is more than 3 times as many as if we use no model, so that is our “lift” over the baseline. Here is another example using te same chart: we can move to the right on the lift curve and contact the top 20% of our customers, and we would end up with a lift of about 2.5. This means that by using the model, we could capture about 50% of the at-risk customers if we contact just 20% of them.

The cumulative lift chart visually shows the advantage of using a predictive model to choose who to outreach by answering the question of how much more likely we are to reach those at risk than if we contact a random sample of customers.
SEMMA and CRISP-DM: Data Mining Methodologies

Data mining is the process of examining large sets of data for previously unsuspected patterns which can give us useful information. Data mining has a great variety of applications: it can be used to try to predict future events (such as stock prices or football scores), cluster populations into groups of people having similar characteristics, or estimate the likelihood of certain health conditions being present given other known variables.

Cross Industry Standard Process for Data Mining (CRISP-DM) is a 6-phase model of the entire data mining process, from start to finish, that is broadly applicable across industries for a wide array of data mining projects. To see a visual representation of this model, visit www.crisp-dm.org.

CRISP-DM is not the only standard process for data mining. SEMMA, from SAS Institute, is an alternative methodology:
Sample – the subset of data should be large enough to be a representative sample but not too large of a dataset to process easily
Explore – look for patterns in the data
Modify – create and transform variables, or eliminate unnecessary ones
Model – select and apply a model that best fits your situation and data
Assess – determine whether or not your results are useful and reliable. Test your results against known data or another sample

According to the SAS website: “SEMMA is not a data mining methodology but rather a logical organisation of the functional tool set of SAS Enterprise Miner for carrying out the core tasks of data mining. Enterprise Miner can be used as part of any iterative data mining methodology adopted by the client. Naturally steps such as formulating a well defined business or research problem and assembling quality representative data sources are critical to the overall success of any data mining project. SEMMA is focused on the model development aspects of data mining.”

This is a good summary of some of the differences between CRISP-DM and SEMMA. Firstly, SEMMA was developed with a specific data mining software package in mind (Enterprise Miner), rather than designed to be applicable with a broader range of data mining tools and the general business environment. Since it is focused on SAS Enterprise Miner software and on model development specifically, it places less emphasis on the initial planning phases covered in CRISP-DM (Business Understanding and Data Understanding phases) and omits entirely the Deployment phase.

That said, there are some similarities as well. The Sample and Explore stages of SEMMA roughly correspond with the Data Understanding phase of CRISP-DM; Modify translates to the Data Preparation phase; Model is obviously the Modeling phase, and Assess parallels the Evaluation phase of CRISP-DM. Additionally, both models are intended to be somewhat cyclical rather than linear in nature. The SEMMA model recommends returning to the Explore stage in response to new information that comes to light in later stages which may necessitate changes to the data. The CRISP-DM model also emphasizes data mining as a non-linear, adaptive process.